Ocean Scientists
We found the research team “Biological Carbon Pump” at Helmholtz-Zentrum Hereon, a research team taking a look at life cycles and interactions of the different organisms in the sea. They look at what types of Plankton (sea organisms from algae to jellyfish to crustaceans) they can observe at different times and at different locations in the ocean, and try to get the big picture of how their food networks work – like who eats whom. https://www.hereon.de/institutes/carbon_cycles/biological_carbon_pump/index.php.en
The methodology of ecological research at this scale is very multidisciplinary: Their team has systems and maritime biologists/ecologists, physicists/chemists, and computer scientists doing machine learning and computer vision.
Ecology research means counting organisms
The ecology method of trying to understand what’s going on is to count how many organisms of a type you can find in a defined space at a defined point in time. You can then take this measurement periodically and in the easiest case, get a correlation between predator and prey population sizes.
The more prey there is, the more predators can be sustained by the ecosystem, until they eat too much of the prey population, and many predators die, eventually leading to growing prey population again. This model is called Lotka-Volterra equations, and the graph above represents the population sizes that oscillate offset from each other.
The team at Hereon is counting organisms using A.I. and computer vision. They use photos from underwater cameras that are either stationary (read: in one ecosystem, getting frequent measurements and observing over a long time), or cameras that are thrown from research ships, then craned back aboard (many different ecosystems, but not many points in time).
Our OASIS (Open-source Automated Sea Imaging System)
We made a microscope that can be connected to a continuous-flow sampling system even aboard smaller boats. It runs autonomously – it pumps a little, then takes a microscope-photo at high resolution, then pumps a little more, before taking the next photo. The photos are saved on the device, and after the expedition the team at Helmholtz can let their supercomputer (https://www.hereon.de/central_units/research_infrastructure/cluster/equipment/index.php.en) count what plankton they saw where, and how many particles of it.
Other manufacturers are making devices to measure other properties of the water, like salt concentration, acidity (pH), and dissolved oxygen and carbon dioxide. Together with the population counts seen in OASIS’s photos and position data recorded by the boat, this can give valuable insight into how the plankton types affect each other in this ecosystem.
The novel thing here is that research data is collected automatically – there is no need for someone with scientific background to be crewing the ship, and potentially get up at night just to take an ocean sample, process it, put it under a microscope and count it by eye. Automated sample collection makes it possible to get data from boats that are on the water anyway, but don’t have experience or time to take samples. For example, the SOOP platform invites racing sailors and cruise ship providers to connect with device makers and scientists toward getting more data points from the oceans.
Holding our hand with CE certification
Hereon needs all devices on their research ships (https://www.hereon.de/central_units/research_infrastructure/ship/index.php.en) to be fully compliant and offered us their in-house expertise to certify our OASIS box.
This is cool, because all products sold in the European Union need a CE mark by law, and we need the experience also for our other products as we make them ready for serial production and widespread distribution.

At Hereon, they have their own technical department with devices and people to test electronics and create documentation required to be compliant.
CE is actually not a certification mark but an indication that a product complies with all EU legislation applicable to the thing which the product is. (https://en.wikipedia.org/wiki/CE_marking#Meaning) Very simplified this means, that our device is electronic equipment, machinery, emitting acoustic noise, not a toy and needs RoHS compliance.
Electromagnetic Interference testing
As an electronic device, although the components we use have CE marks, we still have to test OASIS as a whole. For this, we set up our two prototypes in an RF test chamber tiled with ferrite and fully surrounded with sheet metal. We started the automated sampling of OASIS on a turntable in the chamber, then closed the test chamber door and headed to the control room to see what that big antenna picks up. We also measured conducted emission from OASIS’s power supply back to the grid.

Image: PXL_20241118_085232959.jpg
The expert team operated this very big, very nice spectrum analyzer from the control room and measured 30 MHz to 1 GHz from 4 different sides (90° rotations of the turntable), with the antenna rotated horizontally and vertically.
The photo above actually shows the most eventful measurement: We found that our second delivered OASIS had an interesting emission around 200 MHz – still below “industrial devices” emission limits, but less clear-cut passing than the first OASIS box. So we took note of the turntable’s orientation where we got the most noise, and investigated with a hand probe.

We connected a handheld probe antenna to the big oscilloscope, limited the target spectrum width for higher refresh rate, and put it close to all the components inside OASIS: The pump motor, the industrial camera, the motor control electronics, the DC-DC converter, the Raspberry Pi, and could see the frequency spectrum that everything is running at.
Eventually we found the big peak profile we saw from the test chamber: The display radiates only forward, only in this specific spot, and only on this OASIS serial number 0000-0002.

A neat fix to practice
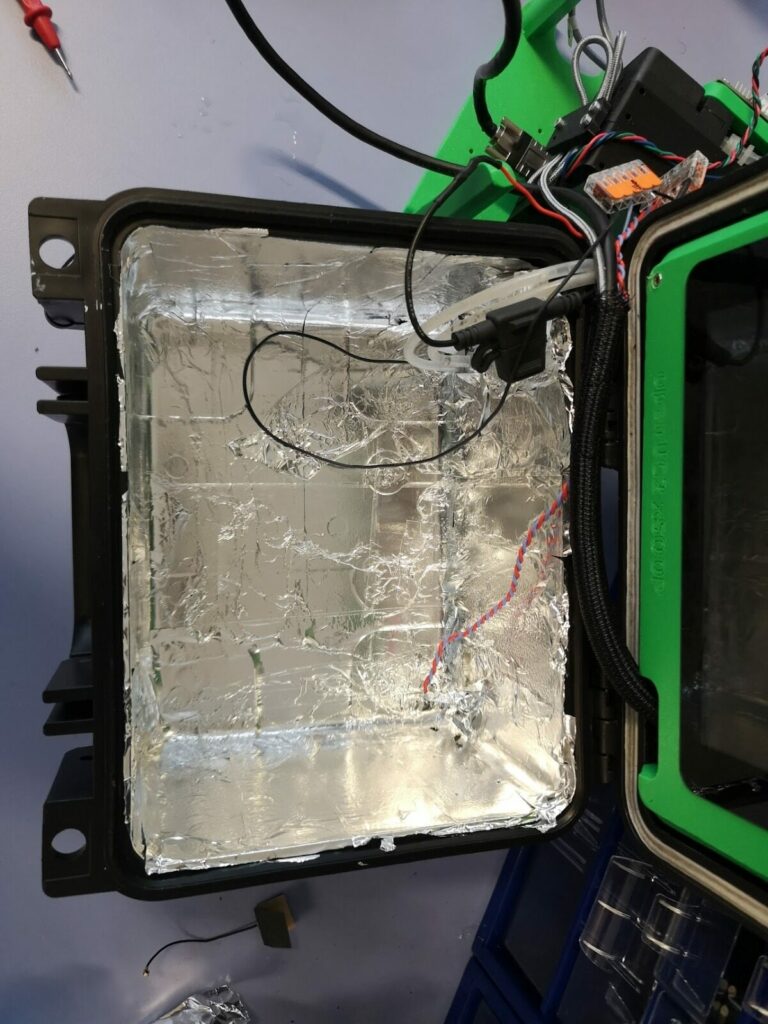
The emission was not critical as it was still under the threshold in the authoritative big test chamber, but we still took the OASIS number 2 back to Jena to fix it. The experts at Hereon recommended putting conductive tape (with conductive glue!) inside the underside of the pelicase, and connect the resulting half-faraday-cage to GND. I had some aluminum tape for years, searching for a use, so I brought it to the office and we lined the bottom half of the case with it.

The glue of our tape was not conductive (tape for air ducts probably), but through some clever folding we got it to measure as one conductive surface. We connected it to the negative WAGO clamp of the whole system and measured again, then closed it back up and took it back up north where we exhibited at a SOOP networking symposium the same week.
But wasn’t the emission through the surface that can’t or at least shouldn’t be taped – the touchscreen? Yes, but that’s where the intended use and product life phases come in. At set-up of the box it’s intended to be open, because you have to use the screen to make sure everything is running and producing good images. But during the longest intended life phase, “regular operation”, the pelicase can be closed so that the radiation shines into the tape-shielded bottom and does not emit outside.
Compliance means documentation
The biggest part of compliance is documentation, and the core of that is evaluating risks in the product, and making technical changes, or training, or instructions and warnings to down-grade the risks.

Image: https://mobacommunity.com/blogs/entry/Machine-Safety-Crucial-for-Mobile-Automation
What risks remain from this (internal, most commonly not published) analysis have to be put in the user manual, where the performance level from the internal analysis determines which pictogram and signal word has to appear. Each remaining risk then gets its own section in the manual when the user may be exposed to it: With pictograms, signal words, description of the risk, and steps to take to avoid injury. Also, pictograms and words on risk-ful parts of the product itself can be a responsible way to handle the risk in a product design (like a hot nozzle and bed of a 3D-printer.
So the internal risk assessment helps with product design (making risks less dangerous through technical means) and determines which risks have to be explained and warned about and how, in the manual and on the product. This leads to safer products and, more importantly for this article, compliance with the machine directive required to mark a product conformité européenne.


